
What happened in the markets in 2025 and what does it mean for investors heading into 2026?
In this quarterly market commentary, Jake Preston, Director of Financial Planning at Beacon Wealth, is joined by Hillary Sunderland, Chief Investment Officer, to break down a volatile year for the economy and financial markets and share our outlook for the year ahead.
📊 In this video, we cover:
-
Key drivers of market returns in 2025, including AI disruption, tariffs, and inflation
-
The S&P 500’s sharp intra-year decline and V-shaped recovery
-
Why staying invested matters during periods of market volatility
-
The decline of “Magnificent Seven” concentration and the broadening of market leadership
-
How international and emerging markets outperformed U.S. stocks in 2025
-
Bond yields, cash returns, and what falling interest rates mean for investors
-
The global economic outlook for 2026, including PMI trends and GDP growth
-
Inflation expectations, Federal Reserve rate cuts, and mortgage rate implications
-
Market risks to watch in 2026, including tariffs, elections, and Fed leadership
-
Where we see opportunities in stocks and bonds going forward
Transcript
Jake Preston: Well, welcome, everyone. Happy New Year. My name is Jake Preston. I am the Director of Financial Planning here at Beacon Wealth, and I’m joined for this market commentary by our Chief Investment Officer, Hillary Sunderland. Hillary, it’s great to be with you.
Hillary Sunderland: Great to be with you, Jake.
Jake Preston: And we’re gonna spend just a few minutes recapping what happened in the economy and the markets in 2025, as well as looking ahead into our outlook for 2026. And so, my first question for you, Hillary, is we know that 2025 was quite an eventful year for the markets. Could you share a brief overview of the key developments?
Hillary Sunderland: Sure, Jake. So, there were a few key drivers of returns in 2025. In the first quarter, the release of DeepSeek, which is a Chinese artificial intelligence lab, disrupted markets in a big way. The release reshaped global assumptions about U.S. leadership in AI, and raised concerns that demand for chips could falter.
That triggered a tech sector sell-off in the first quarter, and then at the beginning of April, the Trump administration announced sweeping tariffs that were broader in scope and much higher than anticipated. As shown by the orange bar on this chart, the peak average tariff rate was about 30% when the tariffs were announced. Which was the highest rate in over a century. This led to significant market turbulence across the globe, and an increase in inflation expectations.
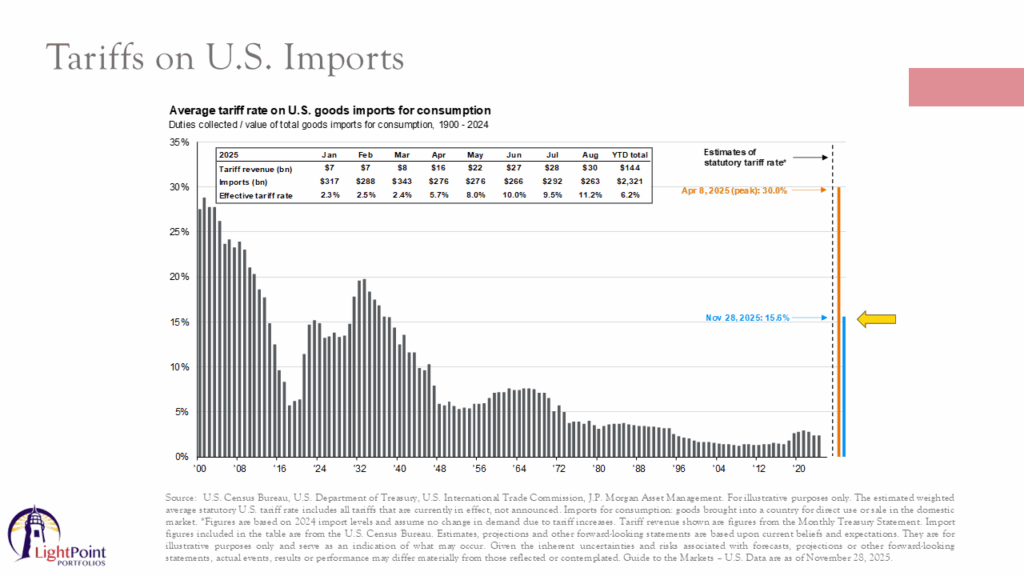
The Trump administration pivoted just a few days later. Tariffs were postponed, and many were renegotiated over the course of the next few months, so that by the end of the year, the average tariff rate was just under 16%, so about half of what it was at the beginning of April. During the year, the tariff costs were partially passed on to consumers, particularly in sectors with thin margins, or…in those businesses where they have a limited ability to substitute different suppliers, and then the rest of the tariffs have been largely absorbed by businesses. So, you can see how these events were reflected in returns.
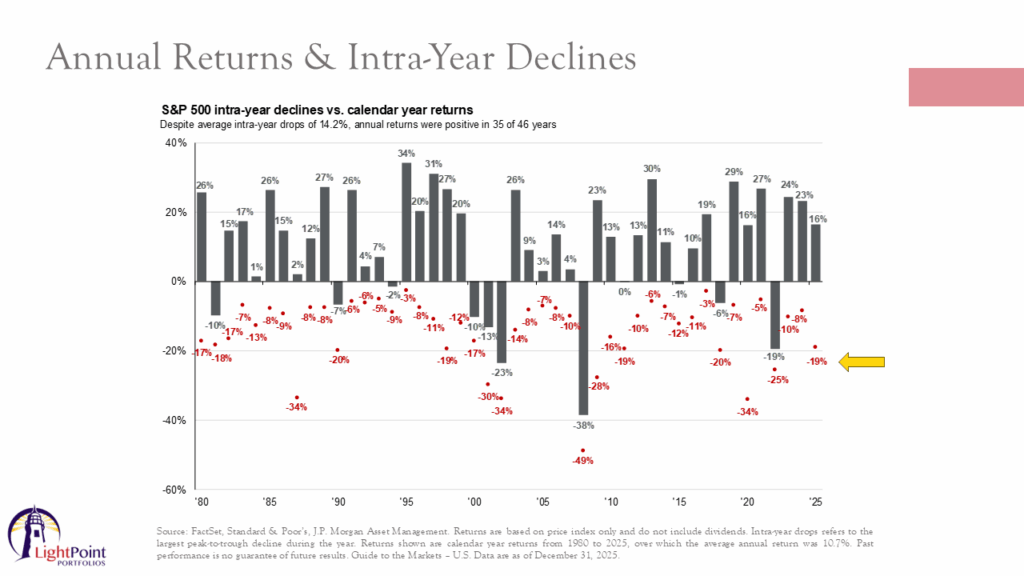
This chart shows that intra-year declines of the S&P 500 index which is a measure of the performance of the largest stocks in the United States, the index fell about 19%, so just shy of that 20% bear market threshold, before it staged a strong rebound as the tariff policies eased.
Foreign governments introduced fiscal stimulus to offset the short-term tariff impacts.
We had the passage of the One Big Beautiful Bill Act, the AI-related theme stabilized, and then, finally, corporate earnings stayed very robust throughout the remainder of the year, so that by year end, the S&P 500 delivered a price return of just over 16%. So, we had a clear V-shaped recovery, and it underscored, yet again, the importance of staying invested. What I think is interesting on this chart in particular is it shows how important it is to stay invested through short-term market turbulence. So, since 1980, the average entry drop for the S&P 500 is 14.2%, but annual returns are still positive in 35 of 46 calendar years.
Jake Preston: Yeah, it was truly a wild ride in 2025 to go from where we were in April to where we finished the year, so thanks for that recap. Over the past 2 years, you have noted often that market returns were heavily concentrated in just a handful of stocks, and so I’m curious, is that a trend that persisted in 2025, or did we have a change?
Hillary Sunderland: Yeah, so that’s a great question, Jake. So, in recent years, as you said, market returns have been heavily concentrated in just a handful of stocks. If you look on the left, at this chart, this shows the performance of the Magnificent Seven. Those are stocks which include companies such as Nvidia, Meta, Tesla, Amazon, Microsoft, etc. In 2023, every single one of them outperformed the index, which is shown there in green.
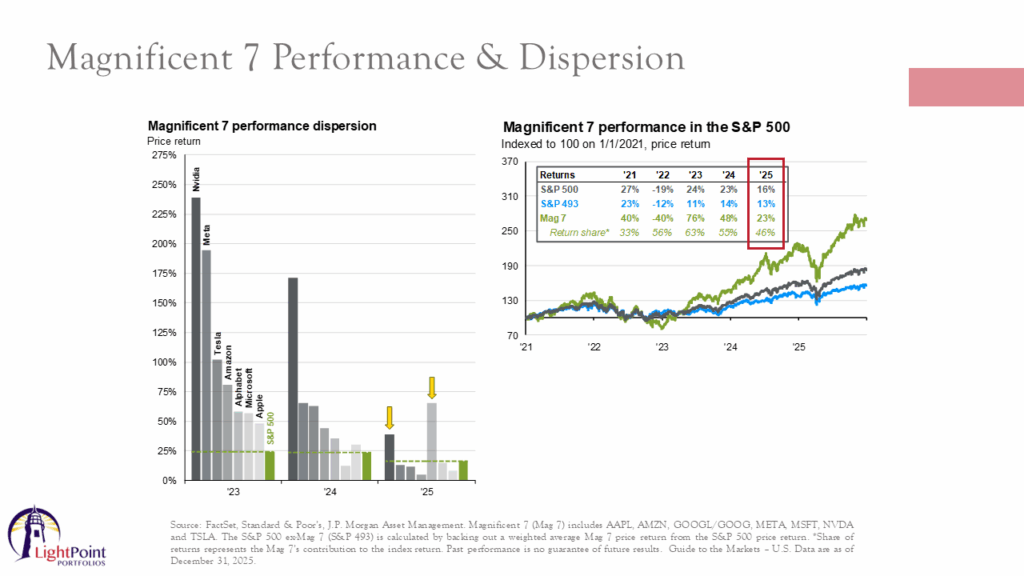
So if you didn’t own all of these stocks, it was a performance headwind, which was the case for us in 2023, as some of these companies don’t pass our faith-based screening standards. In 2024, with the exception of Microsoft, all the rest outperformed the index as well. But coming into 2025, only 2 of the MAG7 stocks managed to beat the S&P 500. That’s indicated there by those yellow arrows. And even those saw much smaller margins of outperformance than they had in previous years. So from this, and also from that chart on the right-hand side of the slide, you can see how the AI-driven rally is really starting to broaden out beyond the original tech leaders. And it’s extended into sectors such as utilities and industrials, which was one of our predictions for 2025. And I think it’s a good reminder that active positioning outside of a small handful of stocks is becoming more critical. If you look at the S&P 500 index right now, which is the most commonly quoted performance when you watch CNBC or the nightly news, you know, about 40% of the index is driven by just a handful of stocks at this point, and so it’s really skewed the performance over time.
What I thought was interesting, maybe, to show you is, how the top 10 companies in the index change over time. The companies that drive market performance change over time because it really reflects broader shifts in the economy. So this chart shows the top 10 stocks in the S&P 500 over the last 40 years.
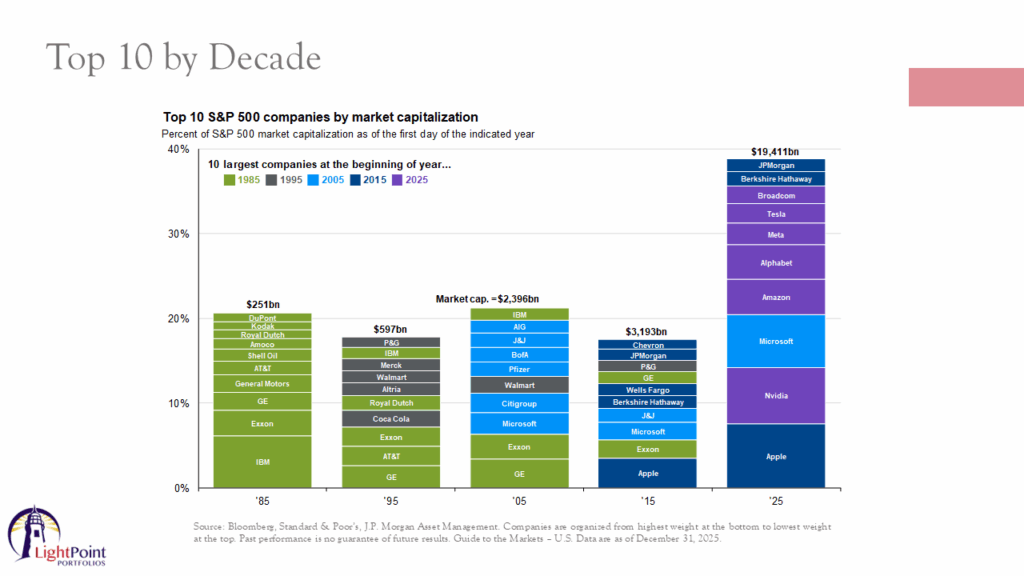
And it’s really fascinating just to look at the changes over time. In the late 1980s and early 1990s, energy and industrials dominated the stock market in the 2000s, that marked the rise of financials and technology, and today, tech clearly leads the index. The only top 10 holding that’s in the index today that was a top 10 holding 20 years ago was Microsoft. Which is quite remarkable, and I think it’s a good reminder that today’s market leaders may not dominate tomorrow, and so it’s always important when investing to skate to where the puck is going, not to where it has been in the most recent years.
Jake Preston: Yeah, that’s a really good point. It’s very interesting. You know, we talk about the importance of a globally diversified portfolio, and also investing for the long term. So, speaking of a globally diversified portfolio, how did markets outside of the U.S. perform in 2025?
Hillary Sunderland: Yeah, so we finally had a turning point in 2025. I thought it’d be best to show you returns globally by using what’s called a periodic table of asset class returns.
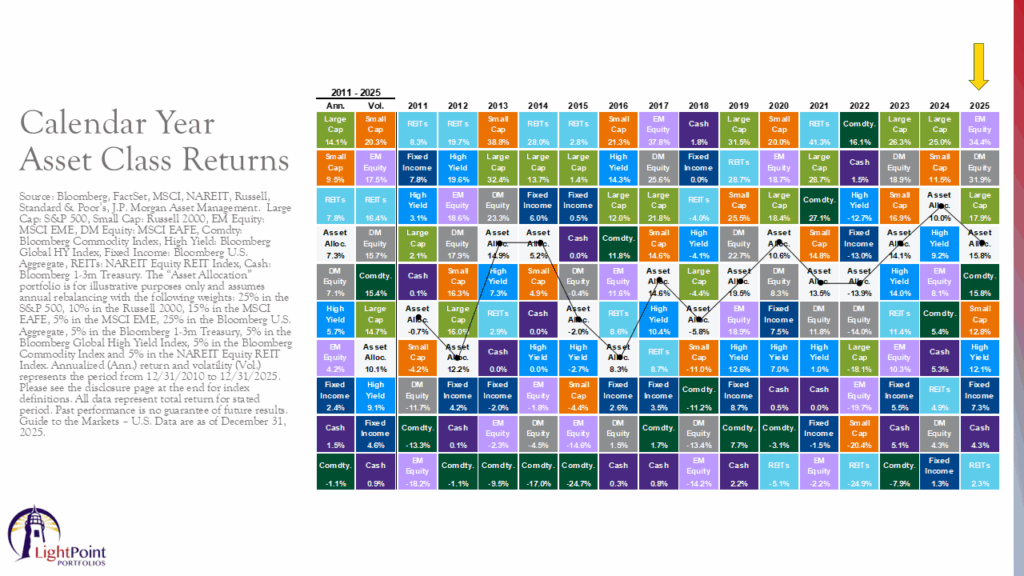
So how to read this chart is each column represents a year, and each row represents an asset class. And then asset classes are ranked from the best performing at the top to the worst performing at the bottom for each year. And so, for the first time since 2017, both emerging market stocks and international developed stocks, the light purple and gray boxes there, outperformed U.S. equities. Coming into the year, those regions of the world had better valuations than domestic stocks. The US dollar appeared overvalued relative to many foreign currencies. Many foreign countries were lowering interest rates, some countries had supportive fiscal stimulus, and so with that backdrop, emerging markets, those are countries like China, Brazil, India, the whole there, on the whole returned 34.4%, international developed stocks, countries like Germany, Japan, those on the whole returned 31.9%. U.S. large-cap stocks came in third place, but still posted very strong double-digit returns.
Going further down the chart, core fixed income, that dark blue box, posted a nice return of just over 7%, which is about what we had forecasted for the year. It’s important to remember, when investing in bonds. About two-thirds of your return tends to come from the starting yield, and yields were high coming into 2025, which was very constructive for the asset class. Yields are still attractive heading into 2026. Which is good for the year ahead. And then finally, cash was one of the worst performing asset classes, earning just over 4%, as the Federal Reserve continued to reduce interest rates during the year, which is a headwind for that asset class, as that directly reduces the yield that you’re going to earn on money market funds.
Jake Preston: Yeah, we’ve talked to some clients recently who are starting to notice the rates on CDs and high-yield savings accounts are starting to steadily decrease, and I anticipate that’ll continue as they keep cutting rates.
Hillary Sunderland: Yes, yes.
Jake Preston: So that’s… that’s a recap of what happened in 2025, so let’s pivot towards looking at 2026 and the year ahead. What is your outlook for the economy in particular?
Hillary Sunderland: Yeah, so globally, the economic backdrop is good. This heat map shows the Global Purchasing Managers Index, or PMI. And how to read this is as you move from the red to the darker green, that indicates stronger economic activity.
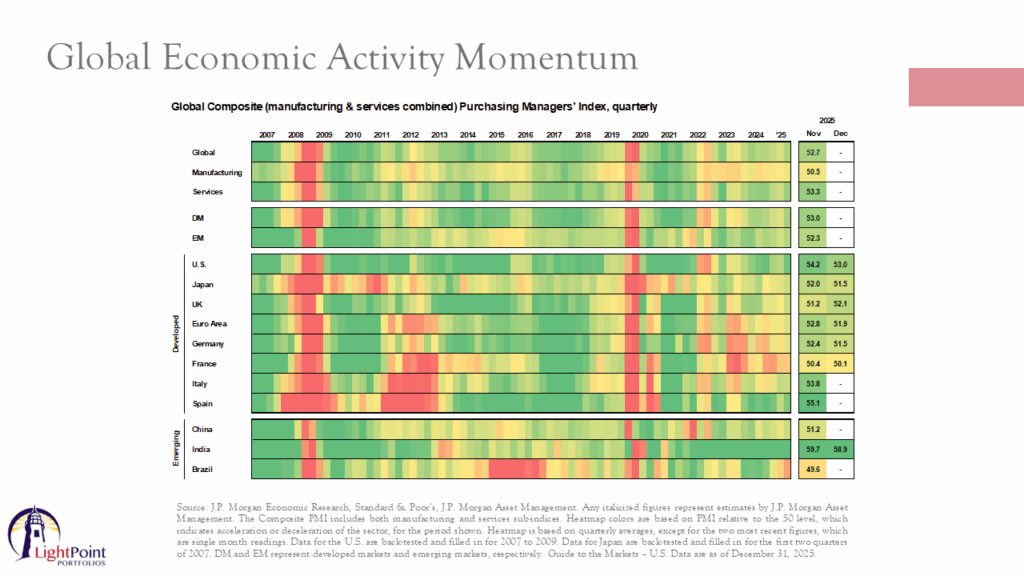
A higher PMI suggests expansion in areas such as manufacturing and services, and that’s generally positive for the markets, because it often aligns with improving GDP growth and corporate earnings. And makes it a clear, or rather, a key indicator of global economic momentum. So overall, if you just look at the colors here, the chart’s trending toward the darker green across most regions of the world, which is a constructive economic backdrop in the U.S. specifically.
We are strong on the first half of 2026. We think economic growth should be fairly strong, for a few reasons. Estimated tax refunds, because of some of the legislation around the One Big Beautiful Bill Act, tax refunds are estimated to be about $4,000 in this year for the average,
Hillary Sunderland: for the average tax filer in the U.S, which is relatively high relative to history. That’s gonna put cash directly into consumers’ hands. This will likely boost spending in the first half of the year, which is a key driver of growth for the U.S, and so we do think that first half of the year should be fairly strong in terms of economic growth. Toward the end of the year, some of that growth is likely to fade. We don’t think there’s going to be a recession, but growth should start to fade out a bit, because that extra cash from the tax refunds will probably be spent rather quickly.
But it’s also a midterm election year. Betting markets are suggesting that Democrats are poised to take the House. In scenarios where Democrats narrowly control the House, while Republicans hold the Senate in the presidency, there tends to be legislative stagnation, nothing really gets done, major new spending or tax cut measures are unlikely to pass. Resulting in more of a status quo, rather than expansionary policies for the economy. And that could potentially slow economic growth in the latter half of 2026. And then on inflation, which I know is top of mind for many of our clients. The latest reading was year-over-year inflation of 2.7%, still high relative to the last, decade or so, last few years of that, on the side, but it’s still rather high, relative to what the Fed would like to see. We do think that 2.7% rate of inflation that was posted recently is probably an undershoot, because some surveys couldn’t be conducted during the long government shutdown that we had. We do think inflation is still likely to tick up a bit in the coming months, as some of those tariff-related effects are still working their way through the economy, and fiscal stimulus, such as tax refund checks, will add upward pressure on inflation. So we expect inflation to tick higher until maybe mid-2026, And then it’s likely to subside as some of those pressures roll off. This should allow the Fed to cut rates, once or twice in 2026. Which will depress the yield you’re seeing on money market accounts even further. I do get a lot of questions on mortgage rates, too. Mortgage rates are likely to move in the same direction as well, but they don’t move in lockstep as the Fed reduces interest rates. Mortgage rates are tied more to longer-term bond yields which the Federal Reserve does not control. That’s linked more to deficits, which continue to be a problem in the U.S. So we do think mortgage rates will come down a bit in 2026, but I wouldn’t expect too much movement there.
Jake Preston: Thanks for that, that’s really helpful. Yeah, we put out a blog post recently about many of the provisions from the One Big Beautiful Bill Act, which a number of them are starting to be enforced in 2026, so if you’re curious about how your specific tax situation might be affected, I’d encourage our clients to check out that article. So we talked about the economy and your outlook for that this year. What’s your outlook for the markets in particular?
Hillary Sunderland: I knew you were going to ask that, Jake. So, you know, we’ve had 3 years in a row of double-digit growth in domestic large-cap stocks. Valuations are a bit expensive relative to history, so I do think we should pair expectations a bit. There are a few things on the horizon, really over the next couple of weeks, that could cause some near-term volatility, namely: There’s yet another government shutdown cliff coming at the end of January. So that needs to all be worked through. A bigger note, the Supreme Court is going to be ruling on the legality of the tariffs imposed by the Trump administration any day now. That could be a big market mover, depending on how that ruling comes out. President Trump is also set to announce his new pick for Federal Reserve Chair in the next few weeks, which could cause some volatility in the bond market, depending on who’s selected, and really whether or not investors believe that the pick for the Fed chair will allow the Federal Reserve to maintain independence from the political side of the equation. So, there’s a lot that could move the markets over the next few weeks, but as the ad said. always says, markets climb a wall of worry, so there’s always something to worry about when it comes to investing. And despite these risks, there are no shortage of opportunities in the year ahead.
Even after the rally this year, international and emerging market stocks still remain attractively priced in comparison to domestic stocks. And the dollar is expected to weaken further in 2026, given interest rate differentials around the world. So those markets could continue to do well. We have a large positioning there within our portfolios for our clients. Meanwhile, bond yields are still elevated relative to the past decade. That offers favorable conditions for more conservative investors, so even though there are some areas of the market that do appear stretched, there are still compelling areas in which to deploy capital, and that’s where we’ll be looking to invest in 2026.
Jake Preston: Well, thank you so much for all of this really helpful information, Hillary, and thanks to you for joining us for this quarterly market commentary. If you have additional questions about what we’ve discussed today, we’d encourage you to contact your advisor or reach out to us at our home office. We are wishing all of you a very prosperous and blessed start to 2026.
Hillary Sunderland: Thanks, Jake.
Do you know what business practices you are supporting through your current investments?
Want to learn more about how your faith can impact how you handle your finances?
Call us today! (540) 345-3891